Executive Console - Overview
Use the Executive Console to monitor your business activities, analyze key performance indicators (KPI), and to launch favorite documents and reports. The Executive Console gives you access to KPIs and favorite files for all of your NDS software application modules. In contrast, the application's User Console, which is similar to the Executive Console, only applies to a specific application module. The Executive Console contains three major areas, the Key Performance Indicators Panel for KPIs, the Console Items Panel for favorite files, and the Content View Panel for displaying certain files.
Tip: For information about specific KPIs for an application, see the Key Performance Indicators topic. This topic requires Internet access and the Adobe Reader.
Directions:
To see directions for...
Opening the Executive Console, click More.
The Executive Console window opens automatically when you launch the Executive Management System.
Executive Console Window Example:
Tip:
To see
detailed instructions for each section or field name in the example below,
the cursor becomes a hand when you position the cursor
over the field or section. Click
once to display the associated topic.
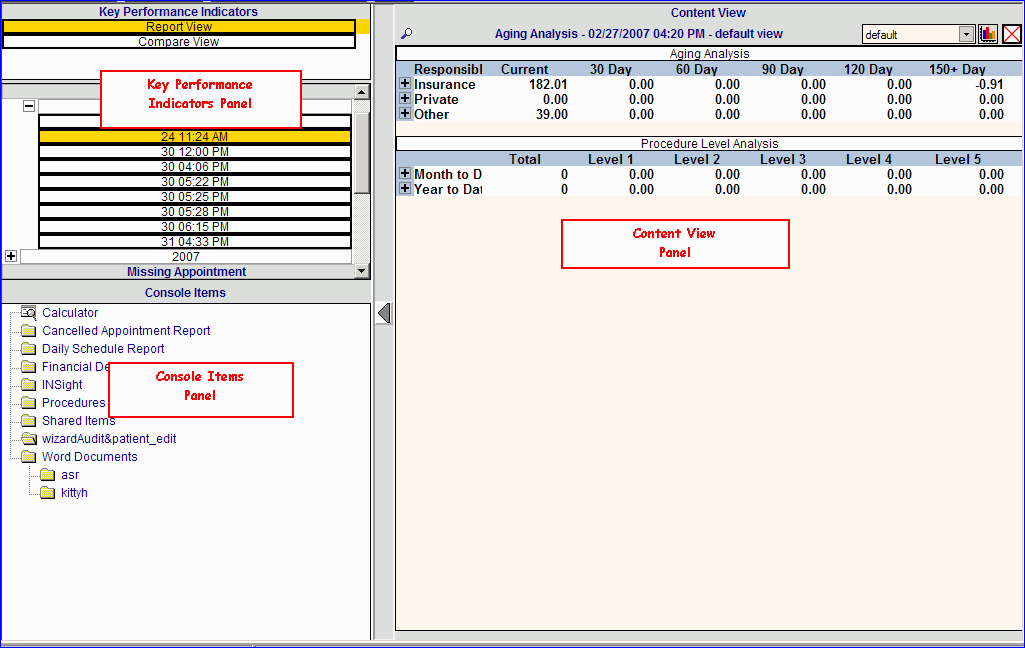
Diagram of the Executive Console, click More.
Tip: To see more information, click an area of the diagram.
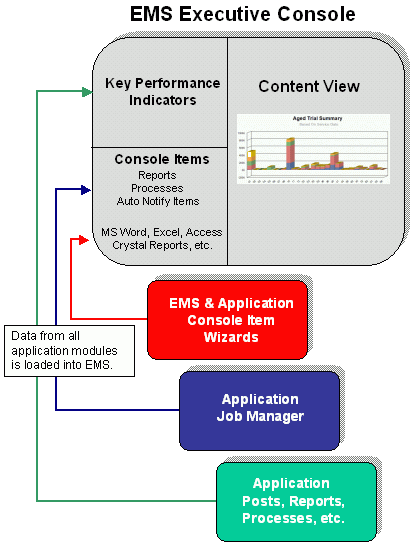
Understanding the console features, click the section name in the table below:
Executive Console Features |
|
Includes step-by-step procedures for various Executive Console tasks. | |
Specifies which key performance indicator (KPI) you want to use as the basis for a report or a compare view chart in the Content View Panel. Tip: For information about specific KPIs for an application, see the Key Performance Indicators topic. This topic requires Internet access and the Adobe Reader. | |
Displays a nested list of favorite reports, documents, data bases, and other files that you can view or maintain. | |
Displays the content for key performance indicators (KPIs) and certain console items such as Crystal Reports, text files, and web pages. | |
Describes the elements of charts (also called graphs) and describes how to create bar charts and line charts using KPI data. |