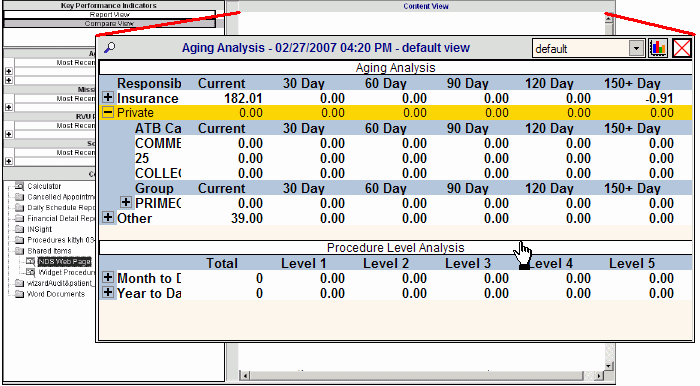
Executive Console - Content View Panel
Use the Content View Panel to display key performance indicators (KPIs) and certain console items such as Crystal Reports, text files, and web pages. The table following the window example describes the Content View Panel for the Executive Console.
Directions:
To display the Content View Panel, simply open the Executive Console.
Tip: To display a console item, KPI report, or KPI chart in the Content View Panel, refer to the instructions in the table below.
Executive Console - Content View Panel Example:
Tip: The following example depicts a key performance indicator report displayed in the Content View Panel.

|
Content View Panel Tasks Tip: To see more information about a field, click the hyperlink for the field name. |
|
|
Changing Panel Size |
To change the size of the Content View Panel: 1. Move
the pointer to the left panel border, until the cursor image changes to
the Resizer Tool 2. Drag the border left or right to resize the panel. |
|
Expanding and Shrinking Panel |
To expand the size of the Content View Panel to the full width of the window, you can temporarily hide the Console Items Panel along with the Key Performance Indicators Panel.
|
|
Viewing Items from the Console Items Panel |
|
|
Working with Folders |
Some Console Items are nested within folders and sub-folders, and some simply appear at the top level, depending on the Console Item Location setting. How to open and close folders:
Tip: For more information about the folder organization, see Understanding Console Item Folder Levels. |
|
Opening Console Items |
To open a console item from the Console Items Panel, double-click the item's icon or title. You can display the following Console Item Types in the Content View Panel:
Tip: The following items do not open in the Content View Panel:
|
|
Viewing Key Performance Indicator Reports Tip: For information about specific KPIs for an application, see the Key Performance Indicators topic. This topic requires Internet access and the Adobe Reader. |
|
|
Opening KPI Reports |
To display a KPI report in the Content View Panel: 1. Click
Report View 2. Click
the desired KPI that you want to display as a report. Tips:
|
|
|
Search: Displays the list of available Report Views in the Search Window. Tip: Report Views are predefined in the software. |
|
To display a chart for an existing Compare View (in the SnapShot Compare Window): 1. Click
one of the KPI Compare View Names in the drop-down list. 2. Click
Chart | |
|
|
Chart: Displays a chart in the SnapShot Compare Window for the specified Compare View Name. Tip: You can display Compare Views directly in the Content View Panel, or in a separate window, the SnapShot Compare Window. |
|
|
Close: Closes the sub-panel for a chart or report. |
|
Viewing Key Performance Indicator Charts |
|
|
Tips: |
|
|
Opening Compare View Charts |
A Compare View is a defined view for a chart, which allows you to graphically compare key performance indicator data in a bar chart or line chart. You can define a temporary Compare View, or you can save the definition for reuse by assigning a Compare View Name to the definition. To open a chart for a Compare View in the Content View Panel: 1. Click
Compare View 2. Click
a KPI. 3. To
display the Compare
Parameters Window, click Search 4. Define
the Compare View parameters. 5. To
display the SnapShot
Compare Chart Setup Window, click Chart
6. Define
the settings, and then click OK 7. If
you want to save the Compare View definition for future use, enter the
Name
and click Save
8. To display the chart in the Content View Panel, click OK at the Compare Parameters Window. Tip: For more information about KPI charts, see the Executive Console - How To... topic. |
|
|
Search: Opens the Compare Parameters Window, where you can define Compare Views for charts. |
|
Compare View Name |
To display a chart for an existing Compare View (in the SnapShot Compare Window): 1. Click
one of the Compare View Names in the drop-down list. 2. Click
Chart |
|
|
Chart: Displays a chart (in the SnapShot Compare Window) for the specified Compare View Name. |
|
|
Close: Closes the sub-panel for a chart or report. |
|
|
Show Totals: A toggle-style button.
|
|
|
Standard View: Returns to the standard three-dimensional (3D) view after clicking one of the other chart view buttons. |
|
|
Direct View: Changes the displayed chart to two dimensions for a single Data Series. Tips:
|
|
|
Side View: Flattens the displayed chart to two dimensions for a single Category. Tip: To view a different Category, click the Category detail in the Chart Legend. |
|
|
Lock:
|
|
Rotation |
To rotate the chart: 1. If
the chart is locked, unlock it by clicking Locked
2. Point to one of the small square handles. 3. Hold the left mouse button down. 4. Drag the handle in a circular motion in either direction - clockwise or counter-clockwise. 5. When
you are satisfied with the rotation results, release the left mouse button. Tip:
To return
to the original orientation, click Standard
View |
|
Chart Legend |
The Chart Legend allows you to focus on specific Data Series and Category values in the chart. To change the chart to display a specific axis value, click a legend Data Series (heading) or Category (detail). Example:
|