Executive Console - Key Performance Indicators Panel
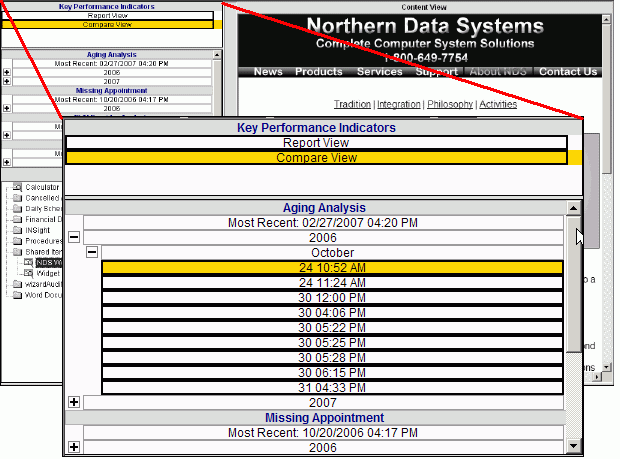
Use the Key Performance Indicators Panel to specify which key performance indicator (KPI) you want to use as the basis for a report or a 3D compare view chart that is displayed in the Content View Panel. KPIs are quantifiable metrics, both financial and non-financial, used to assess the present state of your business and to prescribe a course of action. The KPIs available on the Executive console are predefined in the software. The table following the window example describes the Key Performance Indicators Panel for the Executive Console.
For additional information, click More.
Tips:
For information
about specific KPIs for an application, see the Key Performance
Indicators topic.
Tip: This
topic requires Internet access and the Adobe
Reader.
For more information about working with KPI reports and charts, see the Executive Console - How To... topic.
For more information about charts, see the Executive Console - Understanding Charts topic.
The application used for the KPIs for your site is determined by the setup during your software installation.
For more information about working with data in fields, see the Data Entry Guidelines.
Directions:
To display the Key Performance Indicators Panel, simply open the Executive Console.
Tip: To display a KPI report or a KPI chart in the Content View Panel, refer to the instructions in the table below.
Executive Console - Key Performance Indicators Panel Example:

|
Key Performance Indicators Panel Prompts Tip: To see more information about a field, click the hyperlink for the field name. |
|
|
Working with Heading Levels |
KPIs are nested within headings, which are similar to the nested folders in the Console Items Panel. To reveal a specific KPI, open the appropriate heading level. How to open and close heading levels:
|
|
Changing Panel Size |
To change the size of the Key Performance Indicators Panel:
1. Move
the pointer to the right panel border, until the cursor image changes
to the Resizer Tool 2. Drag the border left or right to resize the panel.
1. Move
the pointer to the bottom panel border, until the cursor image changes
to the Resizer Tool 2. Drag the border up or down to resize the panel. |
|
Hiding & Revealing KPI Panel |
When you expand the size of the Content View Panel, it temporarily hides the Key Performance Indicators Panel along with the Console Items Panel.
|
|
Opening KPI Reports |
To display a KPI report in the Content View Panel: 1. Click
Report View 2. Click
the desired KPI that you want to display as a report. Tips:
|
|
Opening KPI Compare View Charts |
A Compare View, which is a defined view for a chart, allows you to graphically compare key performance indicator data in a bar chart or line chart. You can define a temporary Compare View, or you can save the definition for reuse by assigning a Compare View Name to the definition. To open a chart for a Compare View in the Content View Panel: 1. Click
Compare View 2. Click a KPI. 3. To
display the Compare
Parameters Window, click Search 4. Define
the Compare View. 5. To
display the SnapShot
Compare Chart Setup Window, click Chart
6. Define
the settings, and then click OK 7. If
you want to save the Content View definition for future use, enter the
Name
and click Save
8. To display the chart in the Content View Panel, click OK at the Compare Parameters Window. Tip: For more information about KPI charts, see the Executive Console - How To... topic. |