EDIFICE Inquiry - Executive Reporting Customer Rank Report
EDIFICE's Executive Reporting Customer Rank report function allows you to create your own individualized reports ranking customers on usage, billing and payments. Executive Reporting is flexible and offers many options to allow you to target the information that you want. How you view the report is flexible with options for viewing as a list/table format or as a visual graph or both ways if desired. In addition to being displayed on the screen, report information can be printed and exported to Microsoft Excel, Microsoft Word or saved as a PDF. Graphs can be saved as an image as well.
The customer rank report feature makes it simple to identify your top customers by usage, billing dollars or payments over a specific period. This type of report is perfect for quickly answering questions like these.
Which customers were our top users last month, 6 months ago or last year?
Which customers were our top commercial (or residential) customers last month or last year?
Which customers were the top users within each book or pressure zone.
From the EDIFICE Inquiry, select Tools and then Executive Reporting. Click Create New Report and select Rank.
Enhanced Inquiry - Executive Reporting Customer Rank Report Example:
![]()
Executive Reporting Customer Rank Report Prompts The Customer Rank Report options display. Select the following options: Note: The options used below are an example of how to determine the customer rank to report. Any combination of these options can be used to report your biggest customers.
|
|
Report Type |
Select the type of rank to report. Choices are usage, billed amount, payments received, finance charges or billed and finance charges. |
Post Date |
Choose a defined date range or click Custom to enter a unique date range. |
Select all or specific rate classes. |
|
Number of Customers to Show |
Click up or down to be the desired number of customers to report. |
|
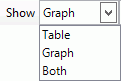
To specify how the report should be presented, click a choice in the drop-down list. Choices are:
Note: Right-click functions include print and export functions, which are explained in the Printing & Exporting Report information Step. |
|
To start the report, click Run. Note: After the report begins, it will process in the background. You are free to do other work. |
Viewing the Report |
|
Sorting, Filtering |
The report information can be sorted, filtered and grouped by any column. To sort, click the desired column heading. To reverse sort, click the column a second time. |
|
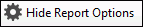
To use the saved options each time the report is run, click Hide Report Options. The report will automatically start processing when run report is selected and the options will not display. To enter or change the options each time the report is run, click until Show Report Options displays. This allows you to edit the options each time the report is run. |
|
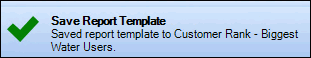
To save the report, click Save. The report is saved as a report for your user. The following prompt displays when the report is saved. Be sure to enter a title and description that allows you to quickly identify the report.
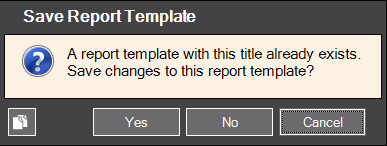
To save changes to a report, the following prompt displays:
To save the changes, click Yes. To omit the changes, click No. Notes:
|
Report Right-click Options
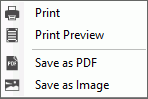
Right-click Graph Options
|
Right-grid options:
The Windows Save As steps:
|


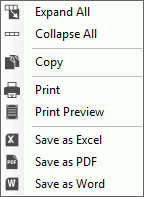
 - To expand all
rows in the grid, click
- To expand all
rows in the grid, click  - To collapse all
rows in the grid, click
- To collapse all
rows in the grid, click  -
-  - To begin printing the displayed information,
click
- To begin printing the displayed information,
click  - Or, to print to the Print Preview window,
click
- Or, to print to the Print Preview window,
click  -To create a Microsoft Excel spreadsheet
from the displayed information, click
-To create a Microsoft Excel spreadsheet
from the displayed information, click  - To create a PDF document from the displayed
information, click
- To create a PDF document from the displayed
information, click  - To create a Microsoft Word document from the
displayed information, click
- To create a Microsoft Word document from the
displayed information, click  .
.